 Data Distillations
Data Distillations utilizes Rock River Laboratory’s vast database of agronomic information from across the Midwest, along with our expert team, to share important insights, quarterly.
Keeping the agriculture industry in front of challenges and opportunities with available agronomic trends is pertinent to farm success. With this in mind, we share relevant data, distilled into graphics and highlights, along with what our team members are gleaning. Understand trends to date and be ahead of the curve of soil fertility.
Sign up to receive alerts when new agronomic Data Distillations are available each quarter by completing the thirty-second form at the bottom of this page or click the link here.
July 2, 2025
Author: Scott Fleming, CCA-PASp
PSNT post-season review
With late spring comes nitrate sampling (Pre-Sidedress Nitrate Testing, PSNT, specifically). Nitrates are pulled for several reasons - one being confirmation that fall-applied nitrogen, be it manure or anhydrous ammonia, is still available in adequate quantity in the spring. Another common reason is verifying that applied nitrogen persists after a particularly wet spring. Finally, the reason I pull these samples on my farm: apply a portion up front, then fine-tune the additional nitrate needs of the crop before side dressing.
At the lab, we aren’t informed of your nitrate sampling reasoning, but we receive boxes and boxes of samples! Below is a quick review of the season and the sample data we saw from those boxes:
Figure 1: University of Wisconsin-Madison Extension PSNT Interpretations

Seasonally, Wisconsin had a mixed bag of weather. To the north, moisture dominated the spring and early summer. Near the southern border, things became dry and have been enjoying intermittent deluges of rain. Both of these situations can spell trouble for keeping nitrogen fertilizer in the cropping system.
Taking a look at the data, the good news is that over half of the submitted nitrate samples have over 100 lbs of nitrate available for the crop! In a time of tight margins, this is welcome news to many growers. Little to no sidedress nitrogen should be needed to finish the 2025 corn crop in over half the samples. The other positive perspective is that only about 25 percent of the samples fall in the zero PSNT credit category. This likely means that in 2024 into 2025, more of the nitrogen applied remained in the soil, rather than leaching out of the rooting zone.
In 2025, 10% of samples contained nitrate equivalent to 35 or 60 lbs/acre of applied N, meaning these growers continued to get mileage out of past applications of manure or nitrogen. Soil testing saved these growers significant costs, helping them arrive at the most economical N application rate.
Figure 2: Wisconsin PSNT Trends 2019-2025

PSNT should not be the entire basis of a nitrogen management program, but it is a valuable fine-tuning tool. Paired with nitrogen models and a solid split application program, it can help maximize profit and minimize environmental risk.
April 23, 2025
Author: Dustin Sawyer, MS
Where did the K go?
Many know that a soil test is a system, not simply a laboratory procedure. That system consists of three parts: the laboratory procedure, the interpretation of the data, and translating the interpretation into a fertilizer recommendation. That final step of creating a fertilizer recommendation is a tricky one, and there are several approaches. One of the most used is known as “build and maintain” in which there is an optimum soil test level, and fertilizer additions are pitted against crop removals to try and reach that optimum. On its face, it seems like a logical and simple system. If soil test levels are above optimum, fertilizer additions should be less than crop removal, and the soil test levels will ease downward toward optimum. The opposite approach is taken if soil levels need to come up. Easy peasy.
Two major assumptions need to be made for the build-and-maintain ideology to work:
Number one: we know how fertilizer additions will impact the soil test value.
Number two: we know what the crop nutrient removal will be.
Both assumptions are a simple statement of an enormous question, and the answer is ultimately unknowable, being controlled by a dynamic system of weather and biological balances. That said, crop nutrient removal is the easier of the two assumptions to study and adjust.
At the end of 2024, data from Rock River Laboratory showed that soil test phosphorus and potassium were increasing in general (see January Data Distillation, below). Now that 2025 is well underway, we can look at the nutrient content of the 2024 harvest and make determinations of crop removal and how it has changed over the past five years. As a service to the agriculture industry, we routinely analyze the mineral content of harvested crops around the world. Using this dataset, we’re able to determine the per-acre nutrient removal associated with each year’s harvest. Here, the dynamic nature of crop removal is on full display.
Several areas of the world and several crops are in the database, but since we’re based in Wisconsin, we’ll focus on corn silage of the Midwest US. For reference, the University of Wisconsin-Madison (UW) uses removal rates of 3.6 pounds and 8.3 pounds of P2O5 and K2O, respectively, for each ton of silage harvested at 65 percent moisture.
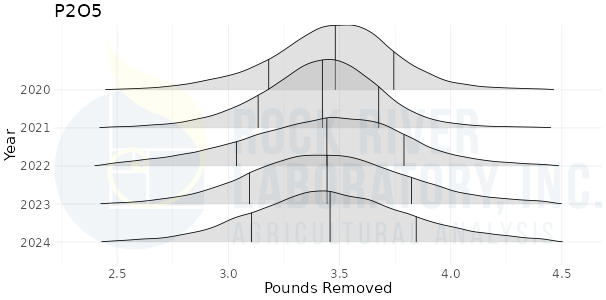
The Rock River Laboratory dataset shows that the UW’s removal rate for P2O5 closely matches the removal found in practice. The data show only slight year-to-year variation in the mean removal, with a high of 3.5 pounds per ton in 2020 and a low of 3.4 pounds per ton in 2021.
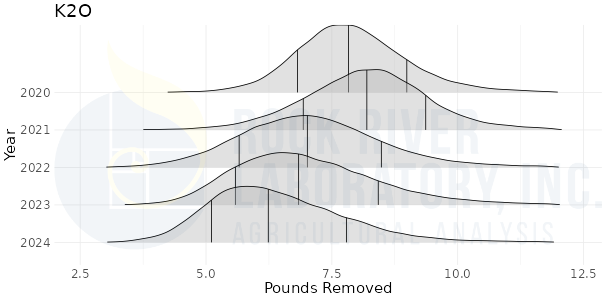
Potassium, on the other hand, shows significant year-to-year variation. The greatest removal was in 2021, with 8.2 pounds per ton, which matches the UW perfectly. However, since 2021 there has been a decline in potassium removal year over year. This culminates in the lowest removal - in 2024 - at just 6.3 pounds per ton. Why potassium removal rates are changing is unclear and will be the focus of study in 2025.
The effective use of soil testing requires proper understanding of the soil/plant nutrient system, and the data presented above show just how steady (P2O5) and variable (K2O) that system can be. It’s important to continually reevaluate the underlying principles, no matter how basic the principle or how well we believe it is already understood. Could the decreasing potassium removal be linked to the recent increase in soil test potassium? Possibly. What could be causing this decreased potassium removal? If you log in to Rock River Laboratory’s website, you too can explore the same data using our Nutrient Removal Calculator. Give it a try!
January 24, 2025
Author: Dustin Sawyer, MS
An update on soil test trends
One abnormal observation is an anomaly, two will pique interest, but it takes three to make a trend. Soil test potassium levels in Wisconsin had been decreasing year over year since the early 2000’s, but that trend turned around in 2022 when soil test potassium (K) increased, on average, for the first time in fifteen years. While the 2022 average was noted, it was only an anomaly. When the 2023 data yielded the same result, with soil test K increasing yet again, that made it interesting.I was excited to see what the 2024 data would tell us. Again, soil test potassium increased. We now have a trend! Our lab’s data demonstrates soil test potassium is on the rebound in a significant way.
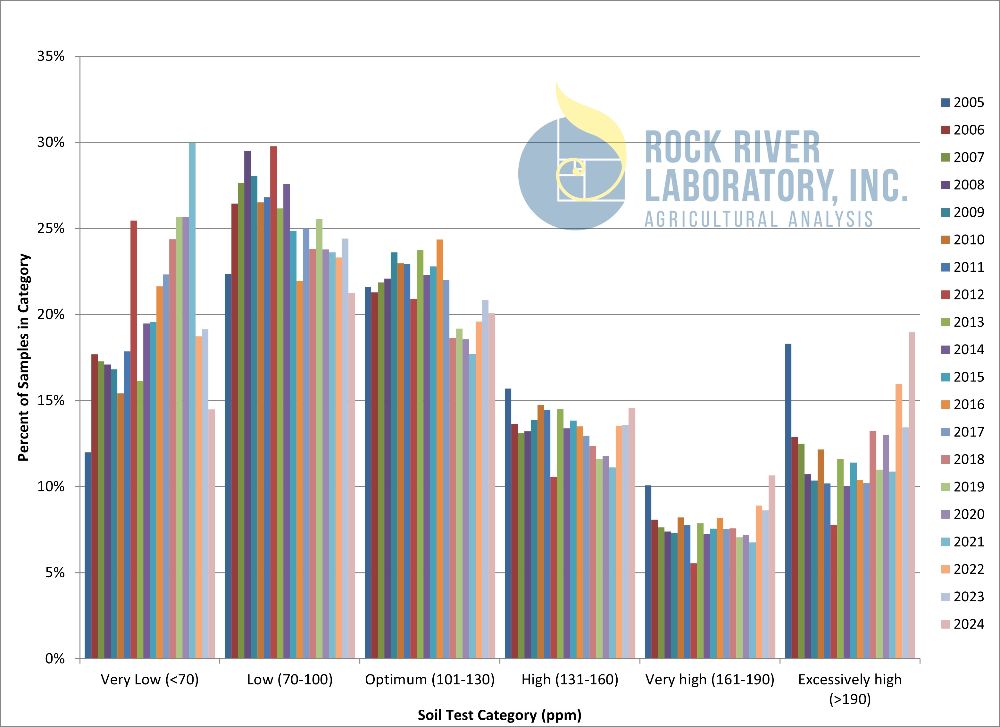
The frequency distribution in Figure 1 shows that the percentage of samples testing in the “very low” category for corn grain production [defined by the University of Wisconsin – Madison as samples with <70 ppm Bray-1 K] was at its lowest in 2005. Only 12 percent of all samples fell into that category. Over the following years, the percentage of samples in that category climbed every year until peaking in 2021 - when 30 percent of all samples tested in the lab were “very low” in soil test K. Of note, while the percentage of samples in the very low category increased, there were correlated decreases in the percentages of samples falling into the “low” (70-100 ppm), “optimum” (101-130 ppm), and “high” (131-160 ppm) categories.
The percentages of samples in “very high” (161-190 ppm) and “excessively high” (>190 ppm) categories remained generally flat over the years. This suggests that those who already had high potassium levels - perhaps people who had access to manure - were not mining their fertility. By contrast, those who may not have had access to manure and were reliant on purchased fertilizer may have had their decisions driven by fertilizer prices and the overall profitability of fertilizer purchases. Further evidence that the market may have played a role in potassium fertility is that the timing of the potassium uptick coincides with a recent drop in potassium chloride prices. Regardless of what caused fifteen years of potassium drawdown, or the recent rebound, the damage appears to have been mostly erased. Only 14.5% of the samples tested in 2024 fell into the “very low” category – putting 2024’s potassium fertility on par with 2005.
Figure 1: Wisconsin Soil Test Potassium Trends 2005 - 2024
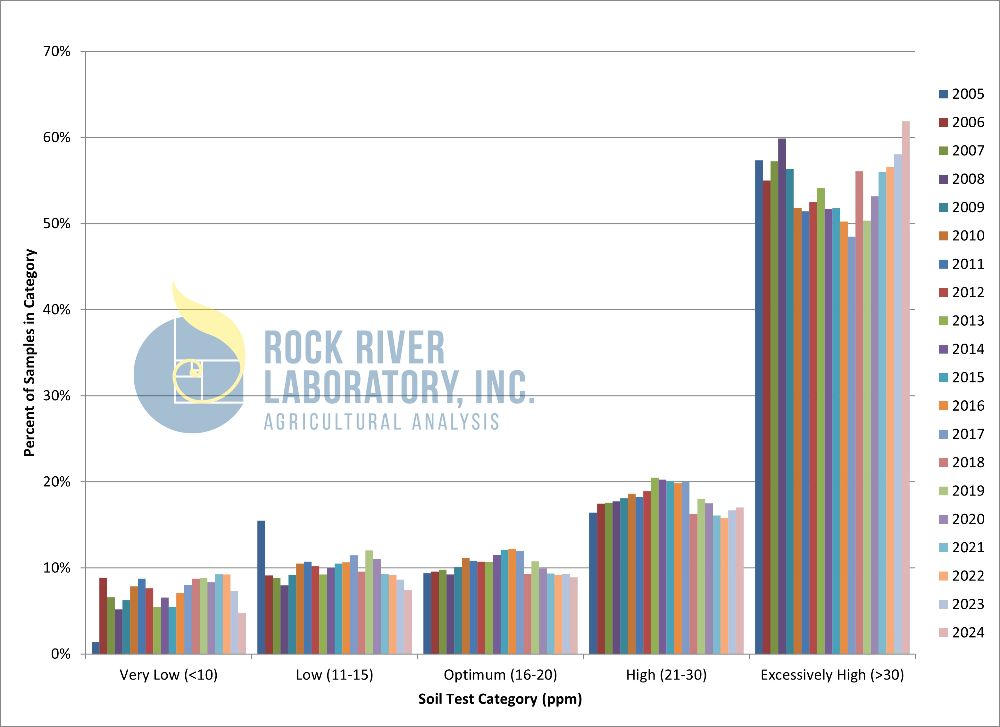
Soil test phosphorus (P) is a different, but similar, story. As seen in Figure 2, the “excessively high” (>30 ppm) category has grown since 2017, and 2024 is no different with 61.9 percent of samples falling into this bin. This is the greatest percentage of “excessively high” samples in the past twenty years. Similar to soil test potassium, the last three years have also seen a decrease in the percentage of samples testing in the “very low” (<10 ppm) category. There is a similar decrease in the “low” (11-15 ppm) category, while the “optimum” (16-20 ppm) category remains relatively flat. This suggests that those fields that were historically low in P fertility are getting the attention they need and moving toward optimum.
Figure 2: Wisconsin Soil Test Phosphorus Trends 2005 - 2024
The soil test data from 2024 is encouraging and shows that soil fertility programs are working. Agronomists and researchers had been sounding the alarm about soil K mining for more than a decade, and the markets appear to have finally lined up in a way that growers were able to make moves to bring K fertility back to previous levels.
