 Data Distillations
Data Distillations utilizes Rock River Laboratory’s vast database of feedstuff and agronomic information from across the United States, along with our expert team, to share important insights, quarterly.
Keeping the agriculture industry in front of challenges and opportunities with available feedstuffs and agronomic trends is pertinent to farm success. With this in mind, we share relevant data, distilled into graphics and highlights, along with what our team members are gleaning. Prepare for and remedy the peaks and valleys of feedstuff components with the help of another set of eyes. Plus, understand trends to date and be ahead of the curve of soil fertility.
Sign up to receive alerts when new Data Distillations are available each quarter by completing the thirty-second form at the bottom of this page or click the link here.
March 24, 2025
Author: Katie Raver, MS
2024 - what lies beneath (the plastic)
By: Katie Raver, MS
For many, the 2024 year crop looks to offer several advantages over the 2023 iteration. As we begin to feed out this new crop, reviewing the database can help better prepare us for what this new crop has in store from a nutrient perspective.
Starch
Digestible starch is a major energy source in corn silage, accounting for roughly 55 percent of the Total Digestible Nutrients (TDN) supplied by corn silage. Starch content is influenced by a multitude of factors, however environmental conditions, particularly rainfall, are especially impactful for starch accumulation. Drought in the Southwest led to lower starch content on average compared to other regions where a slight increase in starch content was observed.
Figure 1: Starch content in corn silage across different US regions (2022-2024)

When looking at starch digestibility pre-ensiling, most regions seem to show improvement, compared to 2023. These factors combined lead to higher likely Rumen Degradable Starch (RDS) for most US regions when compared to 2023. However, exact environmental and management conditions may lead to slightly different outcomes for specific locations.
Fiber
Fiber digestibility is another key quality parameter to evaluate when understanding the corn silage crop potential, making up roughly 18 percent of the TDN contribution. While the Midwest is showing slightly lower than average Total Tract Fiber Digestibility (TTNDFD), the eastern and western US saw sizable jumps in this metric. Southwestern corn silage exhibited TTNDFD similar to previous years. Similar trends were noted across NDFD30 values.
Figure 2: TTTNDFD content in corn silage across different US regions (2022-2024)

Net Impact
So when we combine all factors, what does our 2024 prognosis look like? With so many nutrients moving in different directions, what’s the best way to look at net changes? Tools like the Modified Beef TDN value created by Dahlke and Goeser, and the new Milk 2024 are perfect for just that! When looking at beef per ton, we see that the eastern, midwestern, and western US all saw improvements in both milk per ton and beef per ton estimates, while the southwestern US saw slight decreases in beef per ton potential due to lower starch content and lower fiber digestibility previously. Variability across these values remained quite large in all geographic areas, highlighting the importance that individual geographic locations and management plays in defining an individual crop’s potential.
Fig 3: Milk 2024 estimates for corn silage across different US regions (2022-2024)

Fig 4: Beef per ton estimates for corn silage across different US regions (2022-2024)

Looking forward
While reviewing regional data trends can provide some guidance and prepare us for what to expect from a past crop year, monitoring corn silage as it’s harvested can also help prepare for the future of the crop. Robust harvest sampling programs put producers in a more proactive position to make decisions for future years rather than relying on general trends.
January 24, 2025
Author: Dustin Sawyer, MS
An update on soil test trends
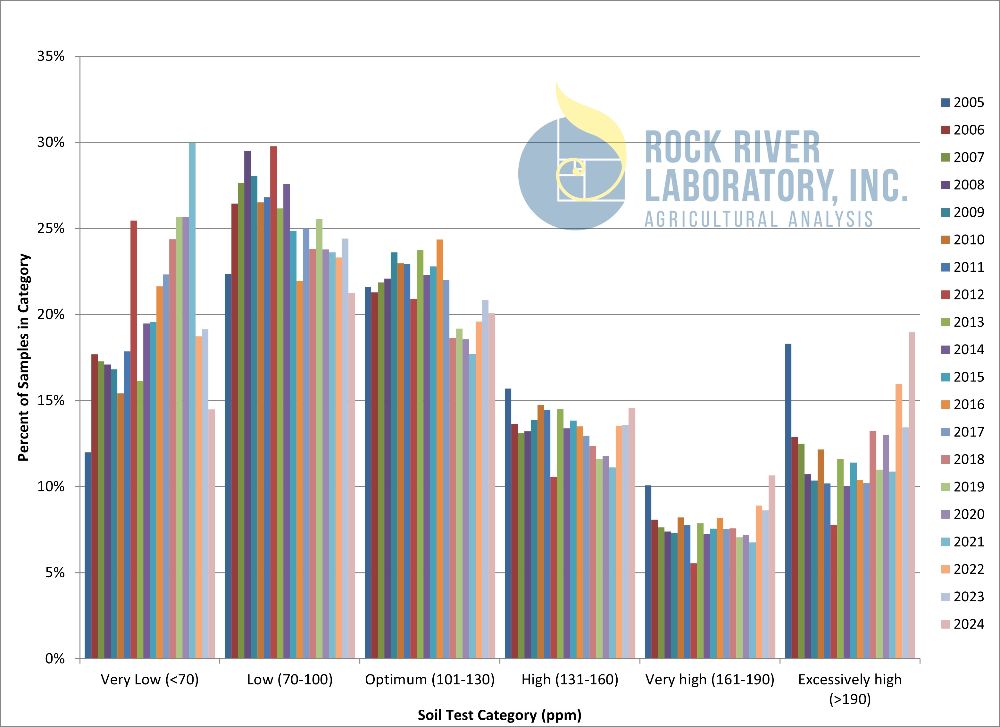
One abnormal observation is an anomaly, two will pique interest, but it takes three to make a trend. Soil test potassium levels in Wisconsin had been decreasing year over year since the early 2000’s, but that trend turned around in 2022 when soil test potassium (K) increased, on average, for the first time in fifteen years. While the 2022 average was noted, it was only an anomaly. When the 2023 data yielded the same result, with soil test K increasing yet again, that made it interesting.I was excited to see what the 2024 data would tell us. Again, soil test potassium increased. We now have a trend! Our lab’s data demonstrates soil test potassium is on the rebound in a significant way.
The frequency distribution in Figure 1 shows that the percentage of samples testing in the “very low” category for corn grain production [defined by the University of Wisconsin – Madison as samples with <70 ppm Bray-1 K] was at its lowest in 2005. Only 12 percent of all samples fell into that category. Over the following years, the percentage of samples in that category climbed every year until peaking in 2021 - when 30 percent of all samples tested in the lab were “very low” in soil test K. Of note, while the percentage of samples in the very low category increased, there were correlated decreases in the percentages of samples falling into the “low” (70-100 ppm), “optimum” (101-130 ppm), and “high” (131-160 ppm) categories.
The percentages of samples in “very high” (161-190 ppm) and “excessively high” (>190 ppm) categories remained generally flat over the years. This suggests that those who already had high potassium levels - perhaps people who had access to manure - were not mining their fertility. By contrast, those who may not have had access to manure and were reliant on purchased fertilizer may have had their decisions driven by fertilizer prices and the overall profitability of fertilizer purchases. Further evidence that the market may have played a role in potassium fertility is that the timing of the potassium uptick coincides with a recent drop in potassium chloride prices. Regardless of what caused fifteen years of potassium drawdown, or the recent rebound, the damage appears to have been mostly erased. Only 14.5% of the samples tested in 2024 fell into the “very low” category – putting 2024’s potassium fertility on par with 2005.
Figure 1: Wisconsin Soil Test Potassium Trends 2005 - 2024
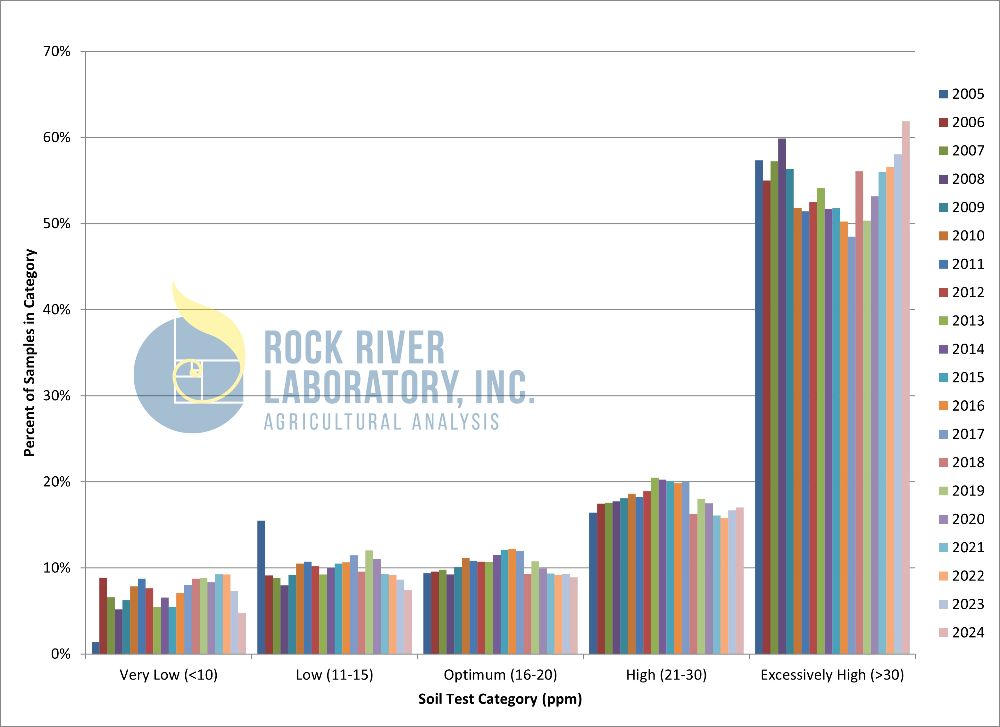
Soil test phosphorus (P) is a different, but similar, story. As seen in Figure 2, the “excessively high” (>30 ppm) category has grown since 2017, and 2024 is no different with 61.9 percent of samples falling into this bin. This is the greatest percentage of “excessively high” samples in the past twenty years. Similar to soil test potassium, the last three years have also seen a decrease in the percentage of samples testing in the “very low” (<10 ppm) category. There is a similar decrease in the “low” (11-15 ppm) category, while the “optimum” (16-20 ppm) category remains relatively flat. This suggests that those fields that were historically low in P fertility are getting the attention they need and moving toward optimum.
Figure 2: Wisconsin Soil Test Phosphorus Trends 2005 - 2024
The soil test data from 2024 is encouraging and shows that soil fertility programs are working. Agronomists and researchers had been sounding the alarm about soil K mining for more than a decade, and the markets appear to have finally lined up in a way that growers were able to make moves to bring K fertility back to previous levels.
December 3, 2024
Author: John Goeser, PhD, PAS
A Cleaner 2024 Crop Coming Into View
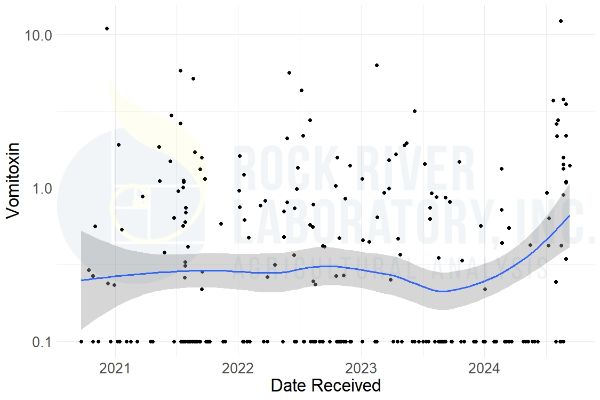
With the 2024 growing season now well behind us, the corn silage and grain hygienic quality is coming into focus. In years past, ear and stalk rot issues during the growing season equated to mold, spoilage yeast, mycotoxin and feed hygiene concerns. These contaminants are known to negatively affect animal health and performance. The start of the 2024 growing season was exceedingly soggy for many, with plant disease concerns on the mind. While this was another year for the record books in some areas, drier weather following pollination and through ear-filling periods equated to tamped down ear and stalk rot from the Midwest through the Northeast. The resulting mold and mycotoxin contaminant levels in the 2024 corn silage crop appear to be muted on the whole. Figure 1 showcases Vomitoxin levels (Deoxynivalenol; DON), as a signal mycotoxin contaminant in the popular forage crop. Vomitoxin is known to negatively affect animal health, rumen and digestive tract performance, and suppress the immune system.
Figure 1: Corn silage vomitoxin (ppm) results for 2021 through 2024 crop years, of samples analyzed by Rock River Laboratory, Inc. in the Midwest and Eastern US regions.

Rarely are single mycotoxins present in forage or grains. Alternatively, multiple different mycotoxin contaminants, at different concentrations, may be present. Hence, producers and nutritionists should use mycotoxin analysis panels, including measuring multiple mycotoxins for a more robust feed mycotoxin evaluation. Expanding to also evaluate Zearalenone trends, Figure 2 details notably less contamination for this mycotoxin as well. Zearalenone is known to negatively affect reproductive performance in livestock.
Figure 2: Corn silage Zearalenone (ppm) results for 2021 through 2024 crop years, of samples analyzed by Rock River Laboratory, Inc. in the Midwest and Eastern US regions.

The red lines within both Figures 1 and 2 detail a benchmark adapted from researchers and scientists. The Rock River Laboratory, Inc. mycotoxin benchmark guideline is available here.
Producers and nutritionists should consider other feed contaminants beyond mycotoxins - such as spoilage yeast or negative bacterial contamination. The former is an underrecognized issue with silages, and can disrupt rumen metabolism and dairy or beef herd performance. Spoilage yeast are a seasonal issue for silages, with clear seasonal trends in contamination or activity levels. Figure 3 highlights the annual trends in silage spoilage yeast contamination, as measured by Rock River Laboratory, Inc. This negative feed hygiene issue is likely of greater concern than mycotoxins for 2024 crop corn silage.
Figure 3: Corn silage spoilage yeast (CFU/g) results for 2021 through 2024 crop years, of samples analyzed by Rock River Laboratory, Inc. in the Midwest and Eastern US regions.
October 2, 2024
Author: Cliff Ocker
The Dirty Truth About Straw
Adding straw to our herds’ rations can help dry down a wet diet, slow the rate of passage, stimulate the rumen, or improve rumination. Plus, straw can be used as a filler to keep animals from eating more energy-dense forages, or even help to stretch other forages.
However, adding straw may bring more into the diet than you bargained for. Recently one of our clients called to review the feed hygiene report that they had requested on a straw sample, which was quite dirty. At the end of the call, they asked the question: is all straw this dirty or just mine? This made me curious, and I began searching our database to see how ‘hygienic’ straw actually is.
The results were a bit shocking, and while our straws inclusion rate is quite low in most diets, it can introduce many unwanted anti-nutrition factors into the diet. Mold and yeast levels tend to run higher than expected in straw but mycotoxins and enterobacteria are often found as well.
The pie charts here (Figure 1) show the prevalence of several levels of mold and yeast on all straw samples analyzed at Rock River Laboratory over the last four years. Note that 75 percent of all samples contained both mold and yeast levels greater than 100,000 CFU/gm. Vomitoxin has been found in about 50 percent of the straw samples analyzed for mycotoxins and the current average is about 0.7 ppm, as noted in Figure 2. While not as prevalent, enterobacteria, when present, averages 337,498 CFU/gm.
Figure 1: Levels and prevalence of hygienic challenges in straw
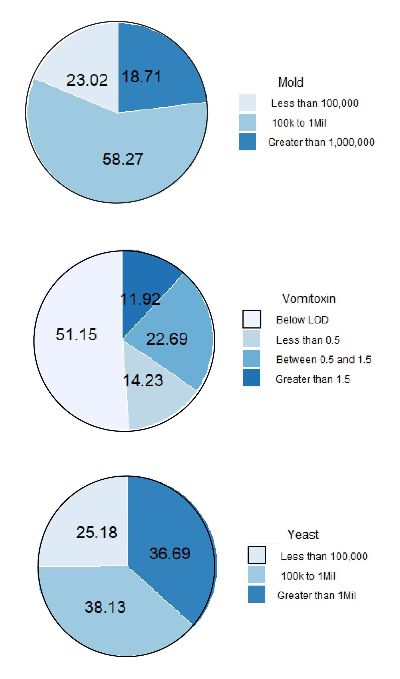
Figure 2: Four-year trend of DON levels in straw
Consider which diets contain straw: far-off dry cows and pre-fresh animals may be receiving straw as a filler. These animals are stressed already as they grow a calf and prepare for high levels of production. Fighting additional hygiene factors may not be the best for their immune systems or their calves.
Of note, the grains coming from these small grain crops may contain challenges as well. Wheat grain in particular, has shown much higher levels of DON (Vomitoxin) this year than in previous years. Looking at our Rock River Laboratory data, the current average level of DON in wheat grain is just over 1 ppm. Beware of an accumulation effect if hygiene issues are present in other feedstuffs.
Depending on the group of animals being fed and the inclusion rate, it may be good to check the cleanliness of your straw before adding too much to the diet. What’s hiding in your straw?
August 7, 2024
Author: Katie Raver
A Pain in the Ash
Although we tend to focus on major nutrients such as crude protein (CP), starch, or Neutral Detergent Fiber (NDF) and their respective digestibility when assessing a nutrient report, ash is also an important analyte that should not be overlooked. High ash in feed can be a concern for a variety of reasons. One being that ash does not have an assigned energy value, so despite minerals that make up ash being essential to animal performance, ash in and of itself does not contain energy from a caloric standpoint. In fact, ash is not considered at all when we look at the Total Digestible Nutrients (TDN) equation . With this in mind, feeds with higher ash content tend to have lower TDN values.
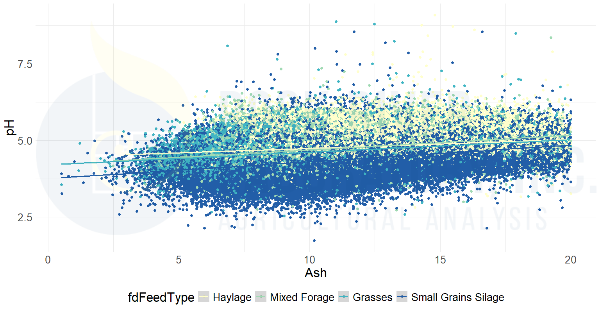
Looking at silages, high ash levels can be an even larger concern as they can be a sign of forage dirt contamination. While some ash is unavoidable [after all, plants do naturally contain minerals], too much ash can be indicative of excess dirt getting picked up in harvest. This can be caused by rain splashing dirt on lower leaves, raking of swathed crops, or cut height, to name just a few. In some cases, too much dirt in forages can act like a buffer and interfere with the natural ensiling process, making it difficult to reach the optimum pH. Typically crops that are subject to a swathing or raking process are more likely to carry higher than average ash content. Figure 1 below shows a trend for increasing pH in haylages, mixed forages, grasses, and small grains silages as ash levels increase. Higher pH may interfere with silage stability over time and can increase the risk for other anti-nutritional factors that negatively affect the silage.
Figure 1: pH vs ash content (%DM) in various silage types
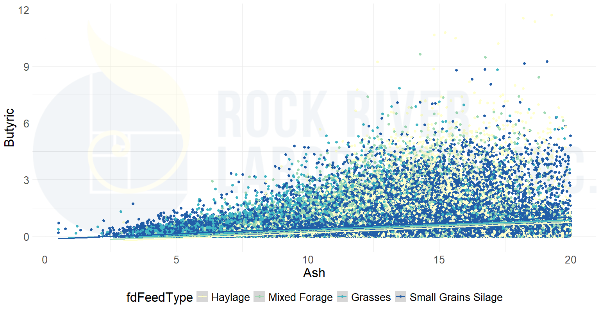
Another concern with high ash silages is potential clostridium contamination. Clostridium bacteria naturally live in the soil, however proper ensiling conditions help keep them at bay. The bacteria have the potential to cause serious health issues in cattle. When clostridium growth in silage results in butyric fermentation, butyric acid at high enough levels can lead to palatability and dry matter intake issues. Figure 2 below shows an increasing risk for high butyric levels as ash level increases. Note, high ash does not always indicate the presence of clostridium or butyric fermentation, as there are many silages represented that have high ash without butyric fermentation.
Figure 2: Butyric acid vs ash content (%DM) in various silage types
The challenges ash creates from a silage stability standpoint are also apparent from a fermentation shrink standpoint. This estimate of fermentation shrink is predicted using the equation by Goeser et. al., 2015 which uses silage nutritional parameters and fermentation. Figure 3 below demonstrates that as ash levels rise potential for shrink due to inefficient fermentation also rises. This represents a loss of usable nutrients and feed available.
Figure 3: Fermentation shrink vs ash content (%DM) in various silage types

When possible, management practices should be designed around minimizing excess ash contamination, especially in ensiled forages. This will help decrease the risk of poor fermentation, and less-than-ideal feed hygiene.

